

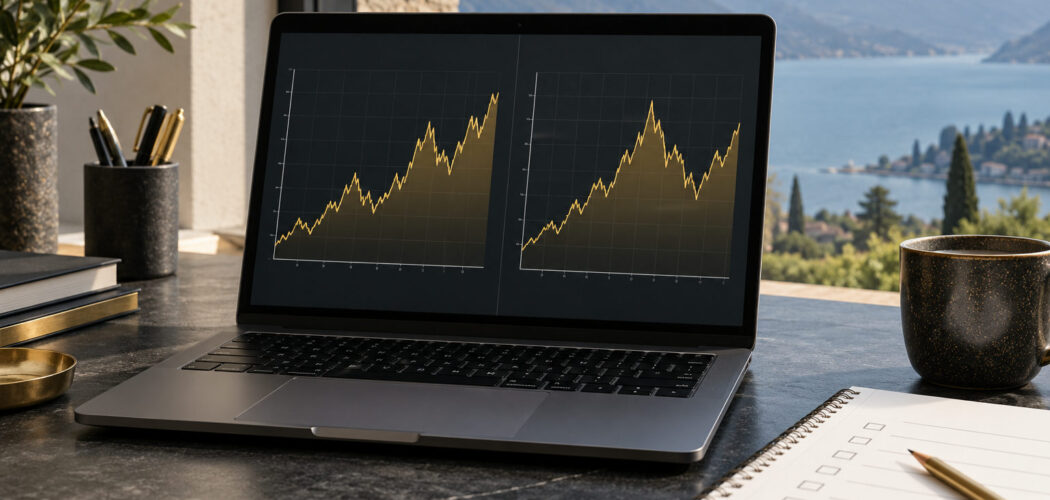
A gold chart scale check records how a price series is displayed before you compare screenshots or discuss the shape of a trend. The chart’s symbol, interval, date range and axis settings all belong in the research note. If those details are missing, two images may look different without giving you a clear explanation for the difference.
The TradingView configuration guide describes several price-scale modes and other chart settings. This article uses that documentation as a practical example. It is educational, not financial advice. Gold investments and trading involve risk; a clear chart view does not predict returns, validate a strategy or prevent losses.
Define the comparison you want to make
Write a short question before changing the chart. You might want to compare two saved views of the same instrument, identify why a screenshot looks steeper or reproduce the view used in a commentary. Keep the question about the display until you have established which settings each image uses.
Choose a single chart and preserve its initial state. Save a permitted screenshot or record the visible settings in a note. Do not begin by changing the scale, interval and range together. You need a reference view to understand what each change does.
Separate a display question from a trading question. Reproducing a screenshot can confirm how its view was configured. It cannot establish that the interpretation attached to the screenshot is correct or that an action based on it would be suitable.
Start the gold chart scale check with the symbol
Copy the full symbol and provider label. Include any exchange or product reference that the chart displays. Do not shorten everything to gold. If you are unsure what the symbol represents, resolve that identity through the provider’s documentation before comparing the plotted series.
Record the currency and unit when available. Keep these labels with the screenshot or worksheet rather than assuming the reader can infer them from the axis. A familiar-looking chart can still represent a different instrument or measurement.
If two views use different symbols, identify that mismatch immediately. You may have a valid reason to compare different instruments, but that requires a different research question. Do not describe the images as the same gold chart simply because both contain the word gold.
Record interval and visible date range
Write the chart interval separately from the period visible on screen. One describes the displayed bars or observations; the other describes the span you can see. A note that says only “long-term chart” leaves both details unclear.
Preserve the start and end of the visible range when you capture a view. If you zoom or scroll, update that record. A change in the visible window can alter the impression of a chart even when you leave the price-scale mode unchanged.
When the displayed range does not show clear dates, record the limitation and use the application’s documented controls to inspect them. Do not guess a period from the shape of the line. The worksheet should describe settings you actually checked.
Identify the price-scale mode
Open the scale settings in the platform you use and read the selected mode. Record its exact name. Do not identify a mode solely by looking at the curve, especially when the view covers a short period or the scale labels are cropped.
The TradingView guide distinguishes Regular, Percent, Indexed to 100 and Logarithmic modes. Use the provider’s explanation for the mode you are checking. A different platform may use different names or controls, so do not present one menu path as universal.
Keep the mode in the caption of any comparison image. A screenshot that omits this field can be difficult to reproduce later. The setting is part of the observation, not a cosmetic detail to remove when the picture is shared.
Understand what the spacing represents
The TradingView explanation describes its Regular scale in terms of absolute price changes and its Logarithmic scale in terms of percentage changes. Read that distinction before interpreting visual distance on the axis. Different spacing rules mean the same data can have a different visual presentation.
Do not turn that distinction into a claim that one mode always reveals the true trend and another hides it. The useful question is what the view is intended to show and whether your interpretation respects its labels. Keep any preference for a mode separate from a factual description of the data.
If you need to illustrate the distinction, use a clearly labelled hypothetical example and show its inputs. Do not insert a current-looking gold price into an example unless you have verified and dated the source. This worksheet can explain the settings without pretending to provide live market data.
Change one setting and compare
Keep the symbol, interval and visible period fixed while changing the scale mode. Capture the new view and label the single change. This gives you a controlled display comparison rather than a pair of screenshots that differ in several unidentified ways.
Check the selected mode again after changing it. The TradingView guide notes that turning off its logarithmic mode returns the chart to the regular scale. Do not assume a previous mode was restored without inspecting the actual selection.
Write down what changed visually, without adding a market forecast. You can describe a difference in spacing or the apparent slope. That description is about the display. It does not prove that the underlying market became stronger or weaker when you changed a setting.
Inspect other view settings
Look for settings that fit or lock the view, include other chart elements or change the position of the scale. Consult the provider’s documentation before attributing a visual difference to one of them. The purpose is to identify relevant settings, not to turn every menu option on.
The TradingView configuration guide describes Auto fitting and a setting that scales the price chart without other chart elements. If you use those functions, record their state. They provide another reason to preserve the complete configuration when reproducing a view.
Keep indicators and overlays listed separately. If you remove an element to make the chart easier to inspect, say so in the comparison note. Do not let a cleaner screenshot imply that the original commentary used the same simplified view.
Check the screenshot before sharing
Make sure the image preserves the labels needed to identify the symbol and period. If a crop removes the scale mode or date range, add a caption with those details. A compact image should remain traceable rather than sacrificing metadata for appearance.
Review whether the capture exposes account information, positions or other details that do not belong in a public research example. Use the application’s documented display options where appropriate and check the final image itself. Do not assume that a template hides every unrelated field.
Keep the original and annotated versions distinct. If you add a line or note to explain a setting, label that addition as yours. A reader should be able to distinguish the provider’s displayed data from your editorial annotation.
Build a reproducible view card
- Full symbol, provider and product reference.
- Currency and unit where supplied.
- Chart interval and visible date range.
- Price-scale mode.
- Relevant fit, lock and overlay settings.
- Single change used in a comparison.
- Capture date and unresolved settings.
Ask a second reader to reconstruct the view from the card. Any question they cannot answer identifies a missing field. Correct that field before using the screenshot as evidence in a broader market discussion.
Keep the conclusion about the view
Our gold price trends guide provides broader context. A gold chart scale check has a narrower endpoint: you can identify the display, repeat the configuration and explain what changed between views. Preserve those settings and evaluate any market claim separately from the appearance of the chart.
By Gold Price Trader Editorial.